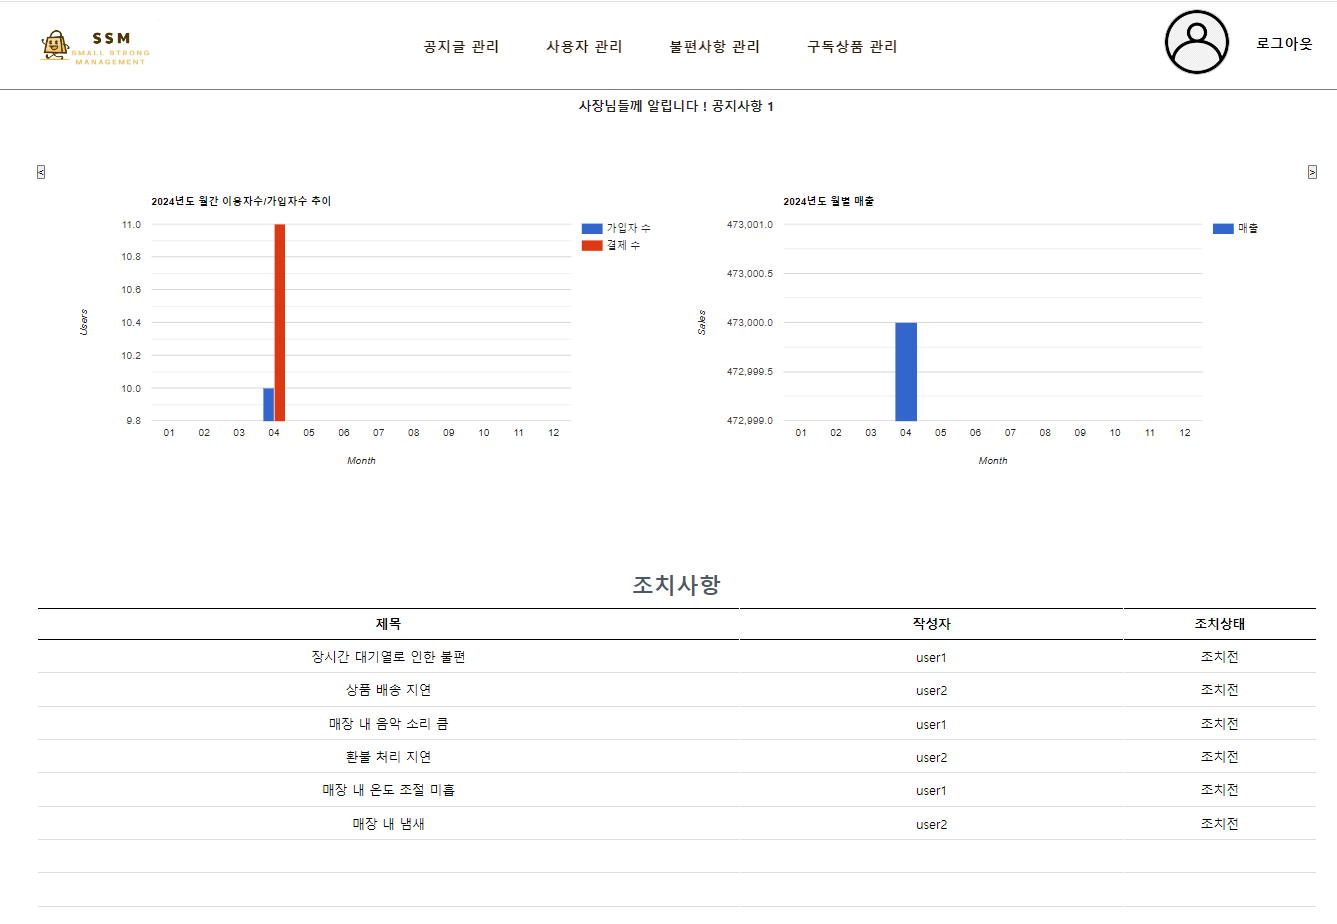
관리자 메인페이지에 해당 사이트 이용자수와 사이트 매출을 그래프로 표시한다 .
ajax로 구현했고 컨트롤러에서 월별로 조회해서 월과 해당 달의 유저수 또는 매출을 HashMap 객체에 담아서 프론트로 보낸다.
그리고 왼쪽 오른쪽 버튼을 누르면 년도가 바뀌고 다시 해당 년도로 요청을 보낸다. api문서가 잘되어있고 되게 기본적인 막대그래프로 그렸기 때문에 프론트딴은 어렵지 않았던거같다.
하지만 서버에서 어떻게 월별로 해서 보낼지와 쿼리문에서 조금 헤매었던 기억이 있다.
#javascript
	//그래프그리기
$(function() {
		// 현재 년도 구하기
		var currentYear = new Date().getFullYear();

		// 그래프 그리기 함수 호출
		drawVisualization(currentYear);

		// 왼쪽 버튼 클릭 시 이벤트 처리
		$("#leftButton").click(function() {
			currentYear -= 1; // 현재 년도에서 1을 빼기
			drawVisualization(currentYear); // 그래프 다시 그리기
		});

		// 오른쪽 버튼 클릭 시 이벤트 처리
		$("#rightButton").click(function() {
			currentYear += 1; // 현재 년도에서 1을 더하기
			drawVisualization(currentYear); // 그래프 다시 그리기
		});

		function drawVisualization(year) {
			$.ajax({
				url : "countUser.do",
				type : "post",
				data : {
					year : year
				},
				dataType : "json",
				success : function(data) {
					var countMap = data.countMap;
					var countSubMap = data.countSubMap;
					var calculateSalesMap = data.salesMap;
					google.charts.load('current', {
						'packages' : [ 'corechart' ]
					});
					google.charts.setOnLoadCallback(function() {
						drawChart(countMap, countSubMap, year);
						drawChart2(calculateSalesMap, year);
					});
				},
				error : function(jqXHR, textStatus, errorThrown) {
					console.log("error : " + jqXHR + ", " + textStatus + ", "
							+ errorThrown);
				}
			});
		}

		function drawChart(countMap, countSubMap, year) {
			var data = google.visualization.arrayToDataTable([
					[ 'Month', '가입자 수', '결제 수' ],
					[ '01', parseInt(countMap["01"]),
							parseInt(countSubMap["01"]) ],
					[ '02', parseInt(countMap["02"]),
							parseInt(countSubMap["02"]) ],
					[ '03', parseInt(countMap["03"]),
							parseInt(countSubMap["03"]) ],
					[ '04', parseInt(countMap["04"]),
							parseInt(countSubMap["04"]) ],
					[ '05', parseInt(countMap["05"]),
							parseInt(countSubMap["05"]) ],
					[ '06', parseInt(countMap["06"]),
							parseInt(countSubMap["06"]) ],
					[ '07', parseInt(countMap["07"]),
							parseInt(countSubMap["07"]) ],
					[ '08', parseInt(countMap["08"]),
							parseInt(countSubMap["08"]) ],
					[ '09', parseInt(countMap["09"]),
							parseInt(countSubMap["09"]) ],
					[ '10', parseInt(countMap["10"]),
							parseInt(countSubMap["10"]) ],
					[ '11', parseInt(countMap["11"]),
							parseInt(countSubMap["11"]) ],
					[ '12', parseInt(countMap["12"]),
							parseInt(countSubMap["12"]) ] ]);

			var options = {
				title : year + '년도 월간 이용자수/가입자수 추이',
				vAxis : {
					title : 'Users'
				},
				hAxis : {
					title : 'Month'
				},
				seriesType : 'bars'
			};

			var chart = new google.visualization.ComboChart(document
					.getElementById('chart_div'));
			chart.draw(data, options);
		}
		function drawChart2(calculateSalesMap, year) {
			var data = google.visualization.arrayToDataTable([
					[ 'Month', '매출'],
					[ '01', parseInt(calculateSalesMap["01"])],
					[ '02', parseInt(calculateSalesMap["02"])],
					[ '03', parseInt(calculateSalesMap["03"])],
					[ '04', parseInt(calculateSalesMap["04"])],
					[ '05', parseInt(calculateSalesMap["05"])],
					[ '06', parseInt(calculateSalesMap["06"])],
					[ '07', parseInt(calculateSalesMap["07"])],
					[ '08', parseInt(calculateSalesMap["08"])],
					[ '09', parseInt(calculateSalesMap["09"])],
					[ '10', parseInt(calculateSalesMap["10"]) ],
					[ '11', parseInt(calculateSalesMap["11"]) ],
					[ '12', parseInt(calculateSalesMap["12"])]
						]);

			var options = {
				title : year + '년도 월별 매출',
				vAxis : {
					title : 'Sales'
				},
				hAxis : {
					title : 'Month'
				},
				seriesType : 'bars'
			};

			var chart = new google.visualization.ComboChart(document
					.getElementById('chart_div2'));
			chart.draw(data, options);
		}
	});
#Controller
@RequestMapping("countUser.do")
	@ResponseBody
	public String selectCountUserByEnrollDateMethod(@RequestParam("year") int year, HttpServletResponse response)
			throws UnsupportedEncodingException {
		// 전달받은 년도로 이용자수 조회해오기
		Map<String, Integer> countUserMap = new HashMap<>();
		ArrayList<CountUser> countUserList = umService.selectCountUserByEnrollDate(year);
		for (CountUser countUser : countUserList) {
			countUserMap.put(countUser.getMonth(), countUser.getCount());
		} // for
		JSONObject sendJson = new JSONObject();
		sendJson.put("countMap", countUserMap);
		Map<String, Integer> countSubMap = new HashMap<>();
		ArrayList<CountUser> countSubList = umService.selectCountUserByServiceDate(year);
		for (CountUser countUser : countSubList) {
			countSubMap.put(countUser.getMonth(), countUser.getCount());
		} // for
		// 전송용 json 객체 생성
		sendJson.put("countSubMap", countSubMap);

		Map<String, Integer> salesMap = new HashMap<>();
		ArrayList<Sales> salesList = umService.selectSalesList(year);
		for (Sales sales : salesList) {
			salesMap.put(sales.getMonth(), sales.getSales());
		} // for
		sendJson.put("salesMap", salesMap);

		return sendJson.toJSONString();
	}
#Mybatis mapper
<!-- 월별 가입자수 조회 -->
	<select id="selectCountUserByEnrollDate" parameterType="_int" resultMap="resultCountUser">
	select to_char(LAST_MODIFIED, 'MM') as month, count(*) count
from tb_user
where to_char(last_modified,'YYYY') = #{year}
group by to_char(LAST_MODIFIED, 'MM')
	</select>
	<!-- 월별 사용자수 조회 -->
	<select id="selectCountUserByServiceDate" parameterType="_int" resultMap="resultCountUser">
	select to_char(PAY_DATE, 'MM') as month, count(*) count
from TB_SUBSCRIBE_PAYMENT
where to_char(PAY_DATE,'YYYY') = #{year}
group by to_char(PAY_DATE, 'MM')
	</select>
	<!-- 월별 매출 조회 -->
	<select id="selectSalesList" parameterType="_int" resultMap="resultSales">
	select to_char(PAY_DATE, 'MM') as month, sum(amount) sales
from TB_SUBSCRIBE_PAYMENT
where to_char(PAY_DATE,'YYYY') = #{year}
group by to_char(PAY_DATE, 'MM')
	</select>
'프로젝트 > 1차프로젝트' 카테고리의 다른 글
| 웹 포스기 테이블 드래그앤드롭 (1) | 2024.05.28 |
|---|---|
| 구독상품 관리 - 포트원을 사용한 상품결제 (0) | 2024.05.28 |
| 구독상품 관리 - 추가,삭제, 수정 (0) | 2024.05.28 |
| 유저관리 - ajax와 모달창을 활용한 유저 정지 (0) | 2024.05.28 |
| 불편사항 - 불편사항 메인페이지에 표시하기 (0) | 2024.05.23 |